Profiling and execution statistics
Please note that this document is in a work in progress state. Plese note that the JSON formats of profiling data/execution statistics might change in the future releases.
Some of the command line interfaces support the collection of profiling and execution statistics data. The collected information can be used for benchmarking, debugging and to fine tune application settings. The collected data is stored in the specified text file in JSON format. The collected data can be load and visualized by the embedded server. Note that self contained example scripts rest-api-XXX collect and expose profiling and execution statistics described below.
Please note that experimental REST API endpoint statistics/profiling-snapshot can supply a garbage collector / memory pool snapshot similar to the ones conteined in the profiling data detailed below.
Example use case
In this example the performance of descriptor generation and the scaling of search is measured and visualized. The nci-250k dataset is used in this example as search targets. Subsets of the pubchem-compound-rnd-1k dataset are used for queries. These datasets are included in the distribution.
Collect data
Collect data from various tools. The workflow is similar to the one detailed in document Basic similarity search workflow. Additionally options -stat and -prof are used to write execution statistics and profiling data.
# Create master molecule storage and master id storage
gzip -dc data/molecules/nci/nci-250k.smi.gz | bin/createMms.sh \
    -in - \
    -out nci-250k-mms.bin \
    -name nci-250k-name.bin \
    -stat nci-250k-mms-stat.txt \
    -prof nci-250k-mms-prof.txt

# Generate cfp7 end ecfp4 descriptors
gzip -dc data/molecules/nci/nci-250k.smi.gz | bin/buildStorage.sh \
    -context createSimpleCfp7Context \
    -in - \
    -out nci-250k-cfp7.bin \
    -stat nci-250k-cfp7-stat.txt \
    -prof nci-250k-cfp7-prof.txt
gzip -dc data/molecules/nci/nci-250k.smi.gz | bin/buildStorage.sh \
    -context createSimpleEcfp4Context \
    -in - \
    -out nci-250k-ecfp4.bin \
    -stat nci-250k-ecfp4-stat.txt \
    -prof nci-250k-ecfp4-prof.txt

# Launch most similar searches for 1, 10, 100, 1000 queries
# Queries are selected from the pubchem-compound-rnd dataset
# For search scaling benchmark we use the cfp7 descriptors only
gzip -dc data/molecules/pubchem-compound/pubchem-compound-rnd-1k.smi.gz | head -1 | bin/searchStorage.sh \
    -frombytes nci-250k-cfp7.bin \
    -qf - \
    -out hits-q-1.txt \
    -stat search-q-1-t-250k-stat.txt \
    -prof search-q-1-t-250k-prof.txt
gzip -dc data/molecules/pubchem-compound/pubchem-compound-rnd-1k.smi.gz | head -10 | bin/searchStorage.sh \
    -frombytes nci-250k-cfp7.bin \
    -qf - \
    -out hits-q-10.txt \
    -stat search-q-10-t-250k-stat.txt \
    -prof search-q-10-t-250k-prof.txt
gzip -dc data/molecules/pubchem-compound/pubchem-compound-rnd-1k.smi.gz | head -100 |bin/searchStorage.sh \
    -frombytes nci-250k-cfp7.bin \
    -qf - \
    -out hits-q-100.txt \
    -stat search-q-100-t-250k-stat.txt \
    -prof search-q-100-t-250k-prof.txt
gzip -dc data/molecules/pubchem-compound/pubchem-compound-rnd-1k.smi.gz | head -1000 | bin/searchStorage.sh \
    -frombytes nci-250k-cfp7.bin \
    -qf - \
    -out hits-q-1000.txt \
    -stat search-q-1000-t-250k-stat.txt \
    -prof search-q-1000-t-250k-prof.txt
Sanitize/compact profiling data
Execution statistics contains the values of system properties and environmental variables. It is usually a good practice to not expose these data through the Web UI. Script data/sanitize-prof.js removes most of the stored such properties and variables keeping only a few whitelisted (see script for details) ones. This script is invoked using tool jseval:
# Sanitize/compact profiling data exposed by the Web UI
bin/jseval.sh -df inp=nci-250k-mms-prof.txt -jsfile data/sanitize-prof.js -out nci-250k-mms-prof-sanitized.txt
bin/jseval.sh -df inp=nci-250k-cfp7-prof.txt -jsfile data/sanitize-prof.js -out nci-250k-cfp7-prof-sanitized.txt
bin/jseval.sh -df inp=nci-250k-ecfp4-prof.txt -jsfile data/sanitize-prof.js -out nci-250k-ecfp4-prof-sanitized.txt
bin/jseval.sh -df inp=search-q-1-t-250k-prof.txt -jsfile data/sanitize-prof.js -out search-q-1-t-250k-prof-sanitized.txt
bin/jseval.sh -df inp=search-q-10-t-250k-prof.txt -jsfile data/sanitize-prof.js -out search-q-10-t-250k-prof-sanitized.txt
bin/jseval.sh -df inp=search-q-100-t-250k-prof.txt -jsfile data/sanitize-prof.js -out search-q-100-t-250k-prof-sanitized.txt
bin/jseval.sh -df inp=search-q-1000-t-250k-prof.txt -jsfile data/sanitize-prof.js -out search-q-1000-t-250k-prof-sanitized.txt
Display results using Web UI
# Load results into embedded server; listen on port 8081; launch browser
# Note that generated descriptors, imported molecules are not read by the server
# Use option -nobrowse to disable browser launch
bin/gui.sh \
    -port 8081 \
    -profres nci-250k-mms-prof-sanitized.txt \
    -profres nci-250k-cfp7-prof-sanitized.txt \
    -profres nci-250k-ecfp4-prof-sanitized.txt \
    -profres search-q-1-t-250k-prof-sanitized.txt \
    -profres search-q-10-t-250k-prof-sanitized.txt \
    -profres search-q-100-t-250k-prof-sanitized.txt \
    -profres search-q-1000-t-250k-prof-sanitized.txt
Since -profres is a multi arity argument you can use
bin/gui.sh \
    -port 8081 \
    -profres *-prof-sanitized.txt \
Visualization of profiling data and execution statistics
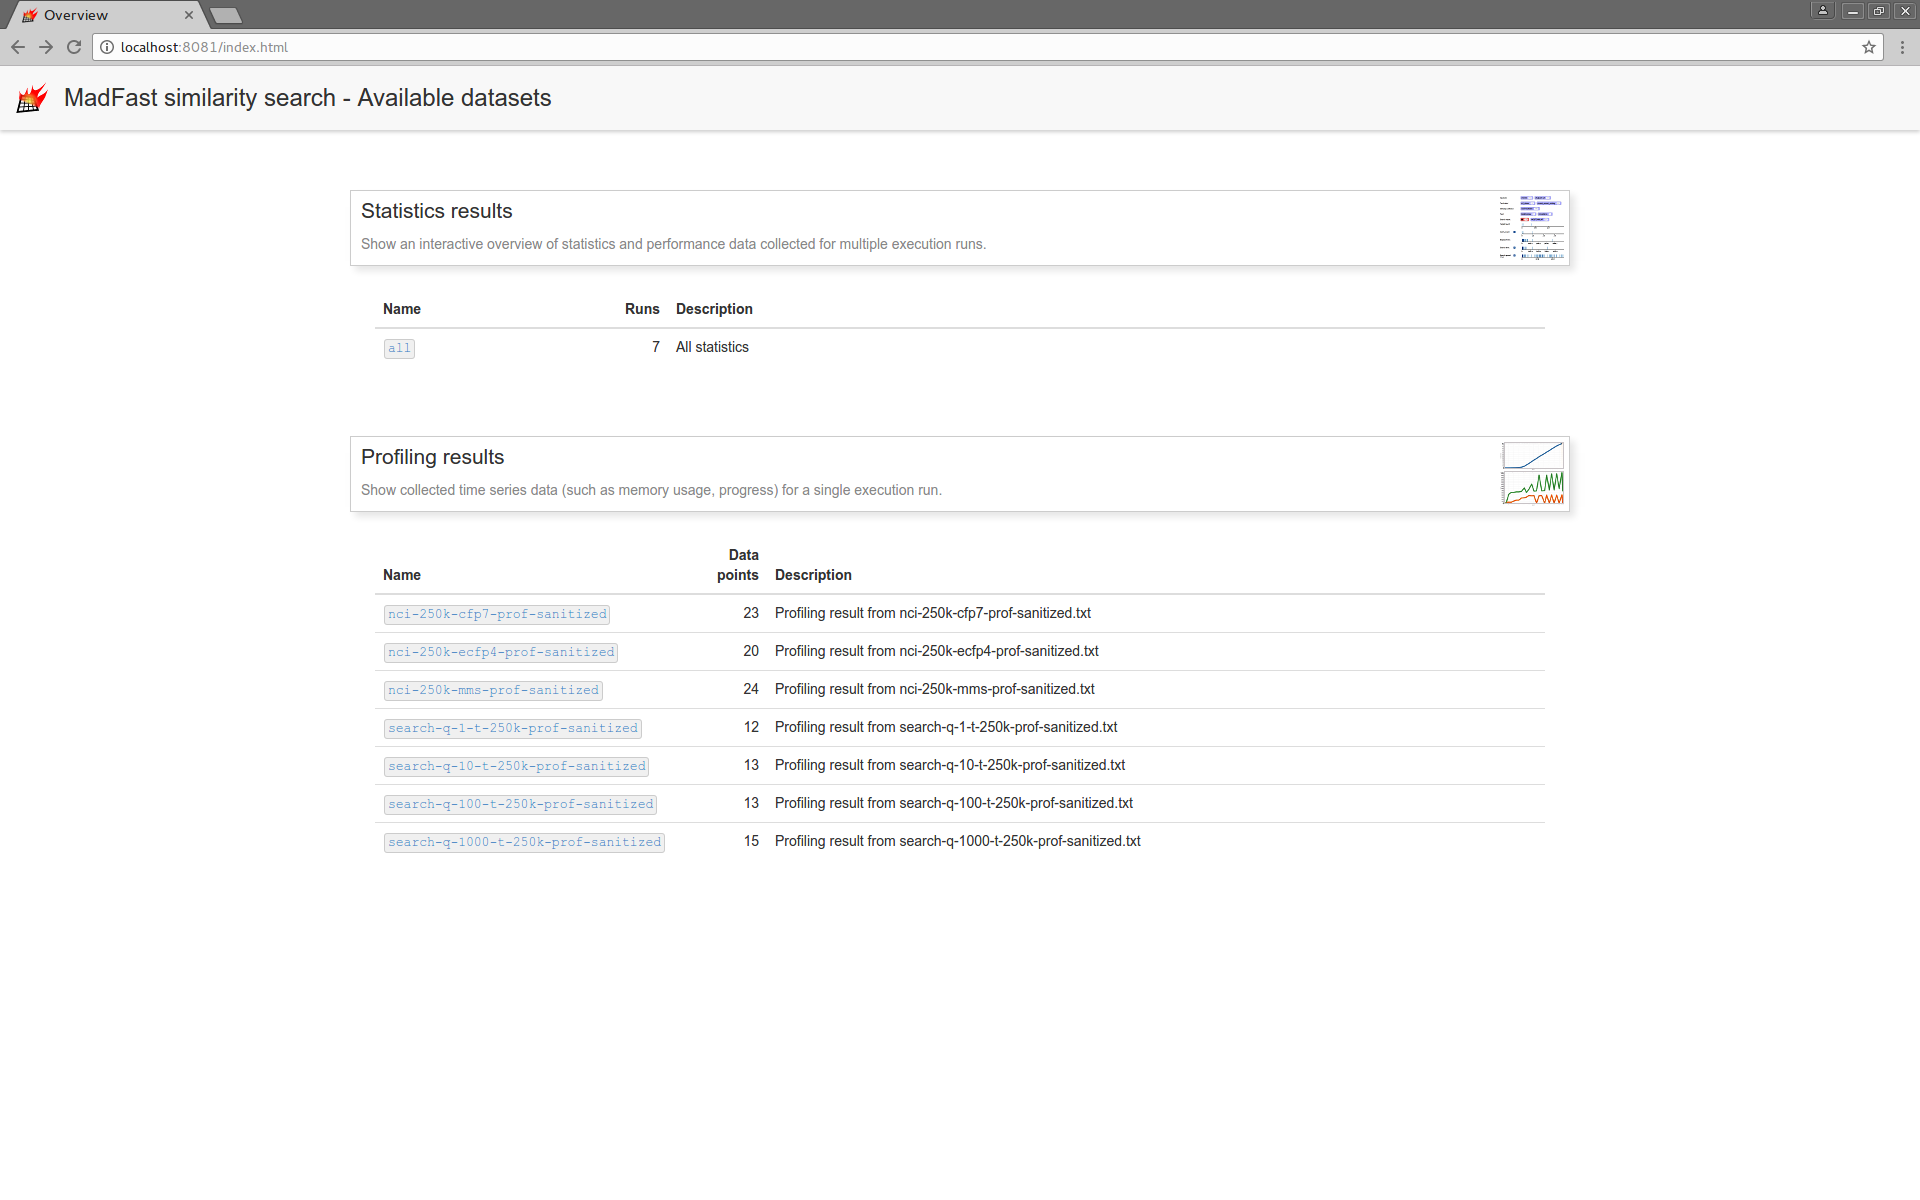
A dynamic HTML based visualization is available in the distribution. Use tool gui.sh with option -profres <FILENAME> to read the results JSON file as above. The launched server shows the read profiling results file(s) on the overview page. Aggregation of the execution statistics data from the individual profiling result files is also accessible with a visualization. See rest api example for more details on tool gui.sh. Current visualization is not complete, it will be cleaned up in a later release.

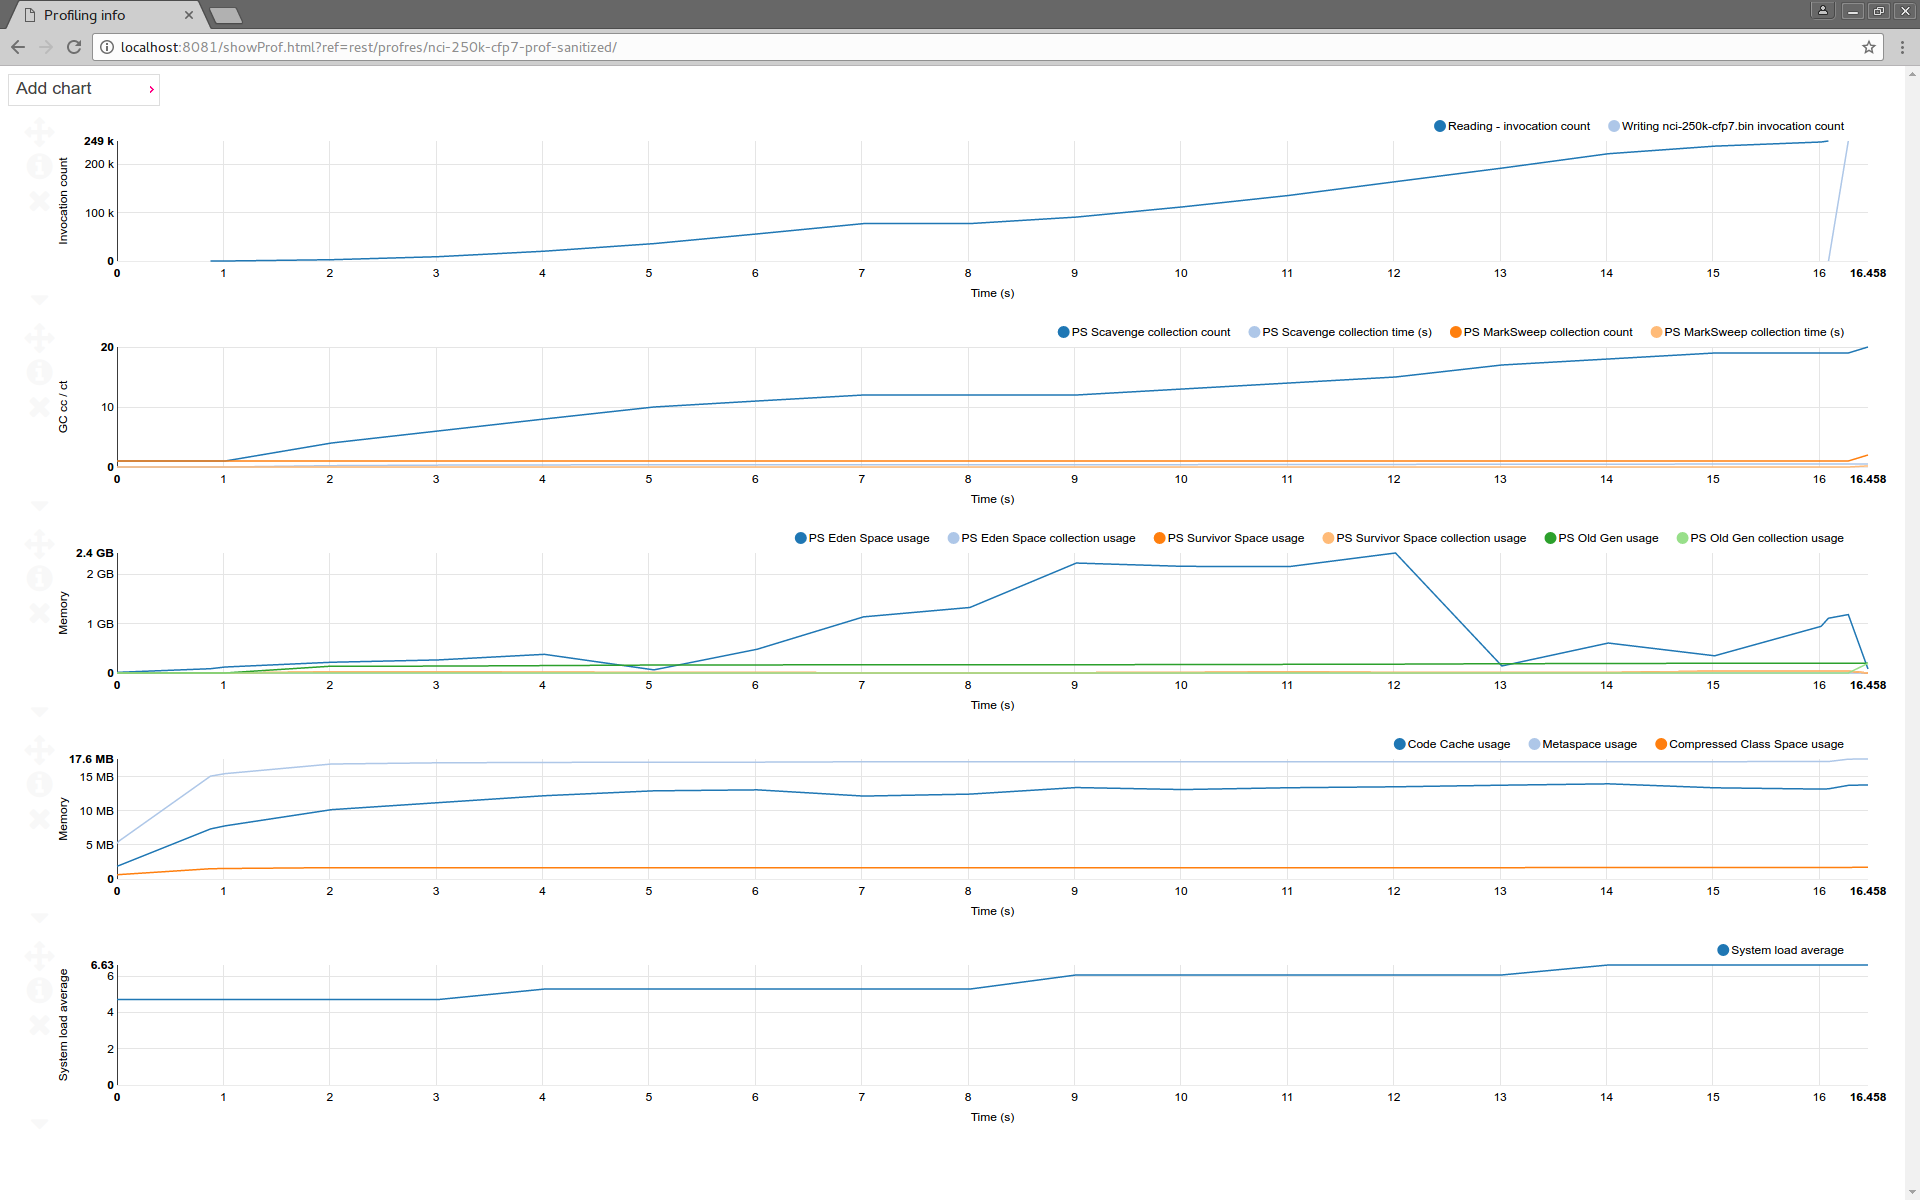
Following the links lead to the visualization pages. Profiling data visualization displays the value of various measures versus execution time.
Profiling data visualization shows the value of various measured parameter values during the execution time. Charts can be moved, scaled. Additional charts can be added.

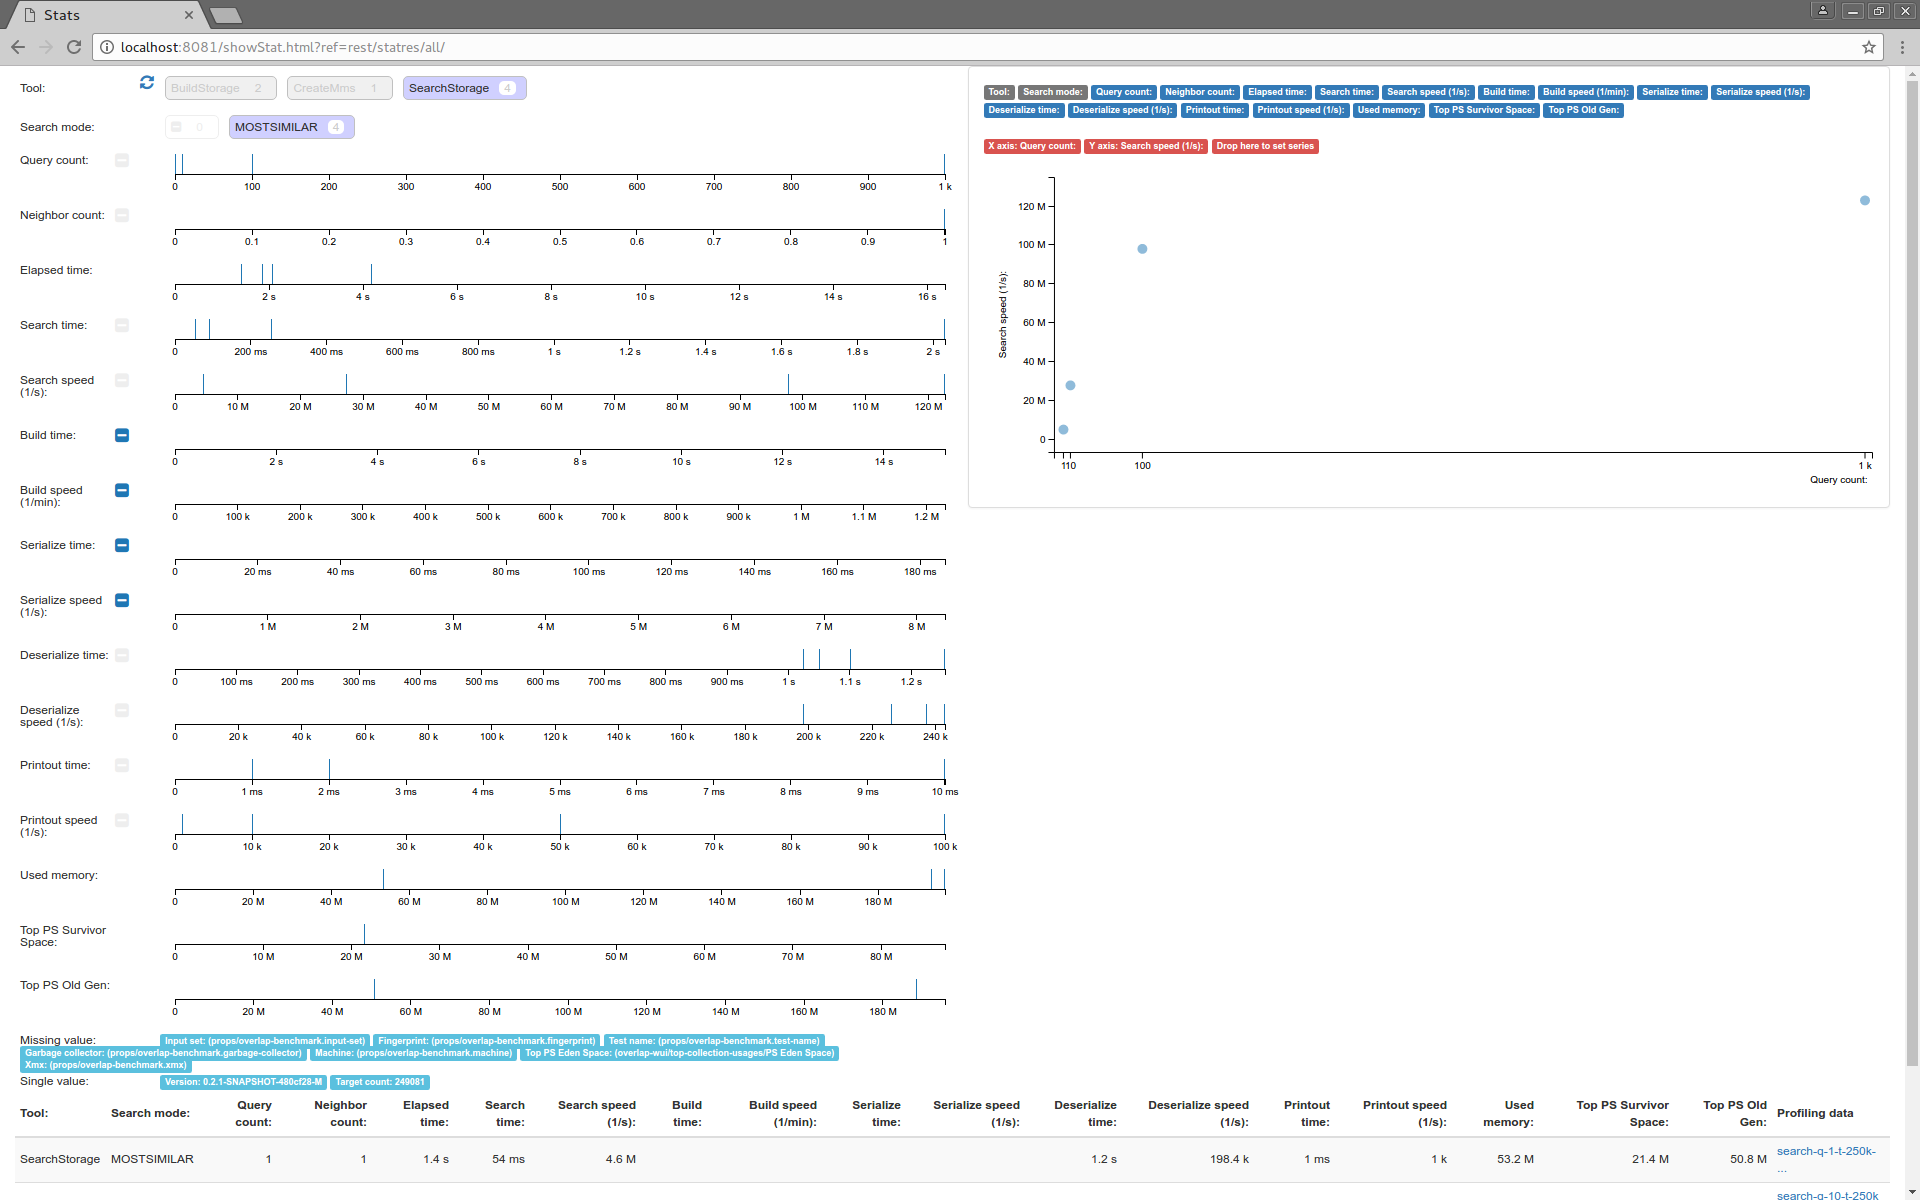
Aggregation of execution statistics collected from the exposed profiling data is also exposed. The distribution of various measured parameters for executions is displayed, can be filtered and plotted on a scatter plot. The individual profiling data display is also linked.

Technical details of the visualization
Web content lib/webapp.war contains display files showProf.html, showStat.html and their dependent libraries (most important for the data analysis are d3.js and crossfilter; for the UI composition additionally jquery, jquery-ui, bootstrap and font-awesome). Display file expects an URL parameter ref to be present in the browser address bar pointing to the location of the results JSON to display, served by the server.
Supported command line interfaces
The following command line interfaces support the collection of profiling and execution statistics:
-
calculateOverlap.shCalculate similarity based overlap analysis. For details see Introduction to overlap analysis. -
buildStorage.shRead molecules, generate descriptors and ID mapping and write them to a serialized file. -
createMms.shRead molecules and store them in a serialized file. Also molecule names or SD properties can be retrieved and stored in separate files. -
searchStorage.shRead serialized descriptor storage file and search descriptors (either parsed from String form or generated using the specified context). -
stdg.shSingle threaded descriptor generator; create string representations capable of comparing reference string descriptor representations for testing. Also can be used to create sample input for custom descriptor import.
For details on the command line interfaces see documentation.
Execution statistics details
Execution statistics contains various data collected during execution in JSON format. Execution statistics is written to a file when option -stat is specified for supported tools.
Common contents:
tool: Name of the tool.version: Version info from classOverlapVersionInfoenv: Environmental variables.props: System properties.cliParameters: Parameters object created from command line arguments. JVM options (like-Xmx...) are not reflected.cliArguments: Command line arguments array. JVM options (like-Xmx...) are not contained.memstatInitial,memstatFinal: Memory info at the beginning and ending of the execution.profSnapshotInitial,profSnapshotFinal: More detailed VM state at the beginning and ending of the execution.startTime,stopTime,elapsedTime: System times in ms.
Statistics of the most important progress observers as well important metrics (like target counts) are also stored. For more details see the APIDOC of the classes representing the written statistics:
| Tool | Execution statistics DTO class |
|---|---|
buildStorage |
com.chemaxon.overlap.cli.BuildStorageStat |
calculateOverlap |
com.chemaxon.overlap.cli.CalculateOverlapStat |
createMms |
com.chemaxon.overlap.cli.CreateMmsStat |
searchStorage |
com.chemaxon.overlap.cli.SearchStorageStat |
stdg |
com.chemaxon.descriptors.alternates.cli.SingleThreadedDescriptorGeneratorStat |
Further attributes
The visualization page checks for specific system properties to use as additional dimensions:
| Property name | Typical usage |
|---|---|
overlap-benchmark.cputype |
CPU model name fetched from /proc/cpuinfo or from sysctl -n machdep.cpu.brand_string on OS X. |
overlap-benchmark.cpucount |
CPU count fetched from nproc --all or from sysctl -n hw.ncpu on OS X. |
overlap-benchmark.memory |
Total memory fetched from /proc/meminfo or from sysctl -n hw.memsize on OS X. |
overlap-benchmark.input-set |
Textual description of input set; set by example scripts |
overlap-benchmark.fingerprint |
Textual description of the fingerprint used; set by example scripts |
overlap-benchmark.test-name |
Differentiate test suites; not used by example scripts |
overlap-benchmark.garbage-collector |
Differentiate garbage collector settings; not used by example scripts |
overlap-benchmark.machine |
Differentiate machines; not used by example scripts |
overlap-benchmark.xmx |
Differentiate max memory settings; not used by example scripts |
To set these system properties for command line scripts use -D<propname>=<value> JVM argument like "-Doverlap-benchmark.fingerprint=cfp7". Note that system properties starting with overlap-benchmark are whitelisted by sanitization script data/sanitize-prof.js.
Profiling data details
Profiling data is a JSON object containing periodic snapshots from various JMX beans providing instrumentation of the running Java VM and execution data detailed above.
Contents:
-
prof: array of periodic JVM instrumentation snapshots. Array elements are serialized from instances of classcom.chemaxon.overlap.cli.prof.ProfSnapshot. For details see its javadoc. These snapshots contain information of the running progress observer(s), serialized from instances of classcom.chemaxon.calculations.common.TimerStatistics. For details see javadoc. -
stat: execution statistics detailed above.
Summary of snapshot data
Each element in the JSON array referenced with key prof is a snapshot, serialized from class com.chemaxon.overlap.cli.prof.ProfSnapshot containing the following data:
timestampTime stamp of the snapshot.memoryPools[]Info on memory pools (name, type, usage, collection usage).garbageCollectors[]Info on garbage collectors (name, collection count, collection time, handled memory pools).heapMemoryUsageInfo on heap memory usage.nonHeapMemoryUsageInfo on non-heap memory usage.systemLoadAverageSystem load average if availabe.objectPendingFinalizationCountApproximate number of objects pending finalization.importantflag is set for the first and last snapshots. It is also set when the snapshot was triggered by an external source. First and last snapshots for progress observers are marked as important. This flag can be considered when the array is decimated to reduce its size.extadditional data, like running progress observer statuses.
Setup profiling data collection
The following command line options are used for setting up profiling data collection:
-prof <FILENAME>If specified profiling data will be collected and written to the specified file.-profres <TIME>Optional parameter specifying the frequency of profiling data collection in miliseconds.
For example when -prof proffile.txt -profres 500 is specified then profiling data will be collected and written into file proffile.txt. Snapshot will be made approximately twice per every second.
Alternative tools
Note that tools jvisualvm (see documentation) and jstat (see documentation) shipped with the JDK also provide VM instrumentation and can extract/visualize most of the data above with the exception of the progress observer statuses.
